
How to Read a qPCR Melt Curve (Beginner's Guide)
Your Ct values look fine — but did the reaction actually amplify the right thing? The melt curve is where you find out.
Quick answer
A qPCR melt curve shows what your reaction actually made. One sharp peak means one specific product — trust that result. Two peaks, a shoulder, or a peak in your no-template control means something extra amplified, usually a primer dimer or an off-target product, and the Ct value from that well should not be trusted until you fix it.
What Is a qPCR Melt Curve?
A melt curve is a short extra step after the last amplification cycle, and it answers one question: did this reaction make exactly one DNA product? The machine slowly heats the samples, typically from about 60 °C up to 95 °C, while measuring fluorescence.
In a SYBR Green reaction the dye only glows while bound to double-stranded DNA, so as each product melts apart, the glow drops. The software plots that drop as a peak, and the temperature at the top is that product's melting temperature, or Tm.
Here's the thing: SYBR Green cannot tell one product from another — it glows for your target, a primer dimer, and any off-target fragment alike. That is why the melt curve exists: without it, a tidy Ct value could hide a messy reaction. This guide covers dye-based qPCR only; TaqMan assays have no melt curve.
What Does a Single Sharp Peak Mean?
A single sharp peak at the temperature you expect means the reaction made one specific DNA fragment — the result you want. Most qPCR products are 80 to 200 base pairs long, with melting temperatures typically between 80 and 90 °C, according to the CD Genomics qPCR curve guide, so a lone peak in that range is a green light.
Before you relax, check that the peak sits at roughly the same temperature in every replicate, and glance at your no-template control (NTC) below — a clean sample curve means little if the blank is glowing too.
What Does a Double Peak Mean?
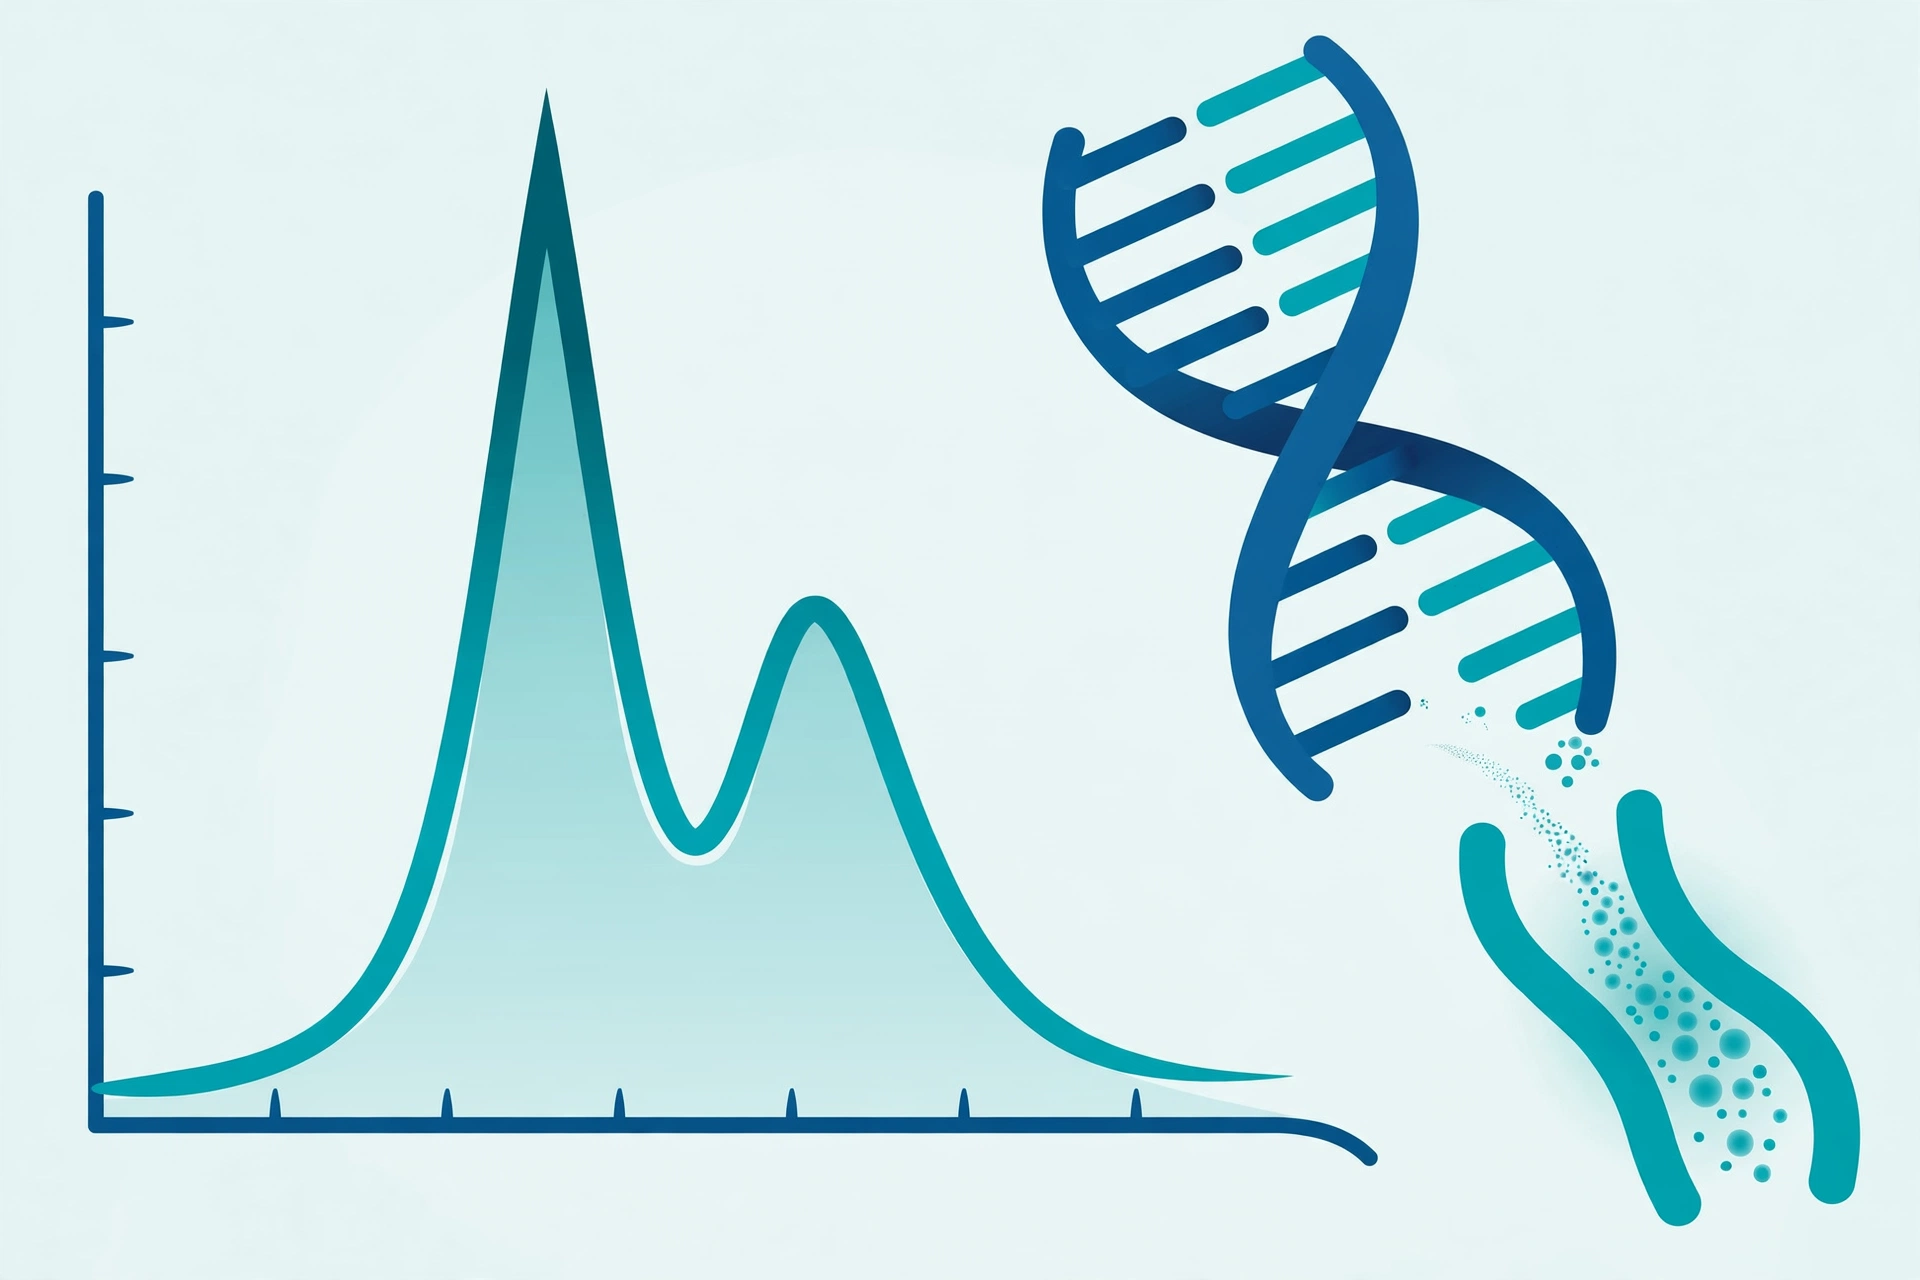
Two peaks mean two different DNA products melted at two different temperatures. Which extra product it is depends on where the second peak sits: a small low-temperature second peak usually means primer dimers, while a second higher peak usually means an off-target product.
| What you see | What it usually means | First thing to try |
|---|---|---|
| Main peak plus a smaller peak below 80 °C | Primer dimers | Lower primer concentration, raise annealing temperature |
| Main peak plus a second, higher peak | Off-target product or genomic DNA | Redesign primers, check for genomic DNA |
| A shoulder on the main peak | Small amount of dimer or related product | Dimer fixes; confirm on a gel |
| A peak in the no-template control | Contamination or primer dimers | Fresh reagents, new primer aliquot |
NEB's melt curve FAQ states the general rule plainly: multiple peaks typically indicate contaminating or off-target products, because a single discrete product gives a single distinct peak.
What Does a Peak in the No-Template Control Mean?
A peak in your no-template control (NTC) is the most informative bad result in qPCR, because the NTC contains no template at all — so anything that amplified there came from your reagents or primers. Read it before you trust anything else on that plate.
A low-temperature NTC peak points to primer dimers (see our primer dimer guide); a peak at your product's own Tm suggests contamination, and means fresh reagents and new aliquots. Do not report low-copy results from such a run.
What If the Peak Is Broad or Has a Shoulder?
A broad, lopsided peak or a shoulder hugging the main peak usually means two products melting at almost the same temperature, so they blur together. Treat it like a mild double peak: try the dimer fixes first, then confirm on an agarose gel.
Gel shows size; melt curve shows species count. One honest exception: some products genuinely melt in two stages, when AT-rich regions or strong secondary structure split one product's melt into two humps, as Addgene's qPCR deep dive flags. If your gel shows a single band of the right size and the double peak repeats across replicates, check the predicted melt profile with uMelt before discarding a good primer pair.
How Do You Fix a Bad Melt Curve?
Work through these in order, changing one thing at a time. Start with primer concentration: dropping to 0.2–0.3 µM often shrinks a dimer peak without hurting yield. Next, raise the annealing temperature by 2–5 °C (see our annealing temperature guide and Tm calculator).
If the peak survives both, redesign the primers using our primer design guide. If the problem is contamination, replace reagents — no cycling tweak will save it.
One afternoon fixing a melt curve beats a month of data you cannot defend — we see this in lab forums every week, where a beautiful standard curve unravels once the second melt peak comes out. If your Ct values also look odd, see our high Ct guide.
Key takeaways
- One sharp peak at the expected Tm means one specific product.
- A small low-temperature peak means primer dimers; a second high-temperature peak means off-target amplification.
- Any peak in the no-template control invalidates low-copy results from that run.
- A reproducible double peak with a single gel band can be a genuine multi-stage melt — check uMelt first.
Frequently Asked Questions
What does a single peak in a qPCR melt curve mean?
Your reaction made one specific product. That is the result you want.
What does a double peak in a melt curve mean?
Two different DNA products melted at different temperatures — usually your target plus a primer dimer or an off-target product.
Can a melt curve replace running a gel?
Not completely. It shows how many products melted, not their exact sizes — run a gel to confirm size.
Does a melt curve work with TaqMan probe qPCR?
No. It is for dye-based qPCR such as SYBR Green; TaqMan probes only fluoresce for their specific target.
Sources: NEB FAQ on multiple melt curve peaks and Addgene's deep dive on qPCR.